Quickstart#
This package and this documentation is under active development. |
|---|
Install#
To obtain the library while it is under heavy development, you can install from source:
pip install git+https://github.com/trelliscope/trelliscope-py
If you are interested in working on development of the Trelliscope library itself, see the Contributing section.
Create Iris Trelliscope#
[1]:
import plotly.graph_objects as go

from trelliscope import Trelliscope
from trelliscope.examples.get_data import get_example_data


def plot_barchart(row):
    """Plot barchart of sepal and petal size. Bar color depend on the Species shown."""
    colors = {"setosa": "lightblue", "virginica": "red", "versicolor": "darkgreen"}
    color = colors[row["Species"]]

    bar_names = ["Sepal.Length", "Sepal.Width", "Petal.Length", "Petal.Width"]
    bar_values = [row[col] for col in bar_names]

    fig = go.Figure(
        data=go.Bar(x=bar_names, y=bar_values, marker=dict(color=color)),
        layout=dict(xaxis_title="Dimension", yaxis_title="Size (cm)")
    )
    return fig


# Load example data included with the trelliscope-py package
df = get_example_data("iris")

# create dataframe with column of Figure objects
df_panels = (
    df
    .assign(barchart=df.apply(plot_barchart, axis=1))
    .reset_index(drop=False)
)
df_panels
[1]:
| index | Sepal.Length | Sepal.Width | Petal.Length | Petal.Width | Species | barchart | |
|---|---|---|---|---|---|---|---|
| 0 | 0 | 5.1 | 3.5 | 1.4 | 0.2 | setosa | Figure({\n 'data': [{'marker': {'color': 'l... |
| 1 | 1 | 4.9 | 3.0 | 1.4 | 0.2 | setosa | Figure({\n 'data': [{'marker': {'color': 'l... |
| 2 | 2 | 4.7 | 3.2 | 1.3 | 0.2 | setosa | Figure({\n 'data': [{'marker': {'color': 'l... |
| 3 | 3 | 4.6 | 3.1 | 1.5 | 0.2 | setosa | Figure({\n 'data': [{'marker': {'color': 'l... |
| 4 | 4 | 5.0 | 3.6 | 1.4 | 0.2 | setosa | Figure({\n 'data': [{'marker': {'color': 'l... |
| ... | ... | ... | ... | ... | ... | ... | ... |
| 145 | 145 | 6.7 | 3.0 | 5.2 | 2.3 | virginica | Figure({\n 'data': [{'marker': {'color': 'r... |
| 146 | 146 | 6.3 | 2.5 | 5.0 | 1.9 | virginica | Figure({\n 'data': [{'marker': {'color': 'r... |
| 147 | 147 | 6.5 | 3.0 | 5.2 | 2.0 | virginica | Figure({\n 'data': [{'marker': {'color': 'r... |
| 148 | 148 | 6.2 | 3.4 | 5.4 | 2.3 | virginica | Figure({\n 'data': [{'marker': {'color': 'r... |
| 149 | 149 | 5.9 | 3.0 | 5.1 | 1.8 | virginica | Figure({\n 'data': [{'marker': {'color': 'r... |
150 rows × 7 columns
[2]:
# build Trelliscope and view in new browser tab
Trelliscope(df_panels, name="Iris", show_progress_bar=False).write_display().view_trelliscope()
INFO:root:Using ['Species', 'index'] to uniquely identify each row of the data.
INFO:root:Saving to /tmp/tmpf2m_z6fx/iris
INFO:root:No layout definition supplied. Using Default.
INFO:root:No labels definition supplied. Using Default.
INFO:root:Trelliscope written to `/tmp/tmpf2m_z6fx/iris`
[2]:
A trelliscope display
* Name: Iris
* Description: Iris
* Tags: None
* Key columns: ['Species', 'index']
---
* Path: /tmp/tmpf2m_z6fx
* Number of panels: 1
---
* Meta Info:
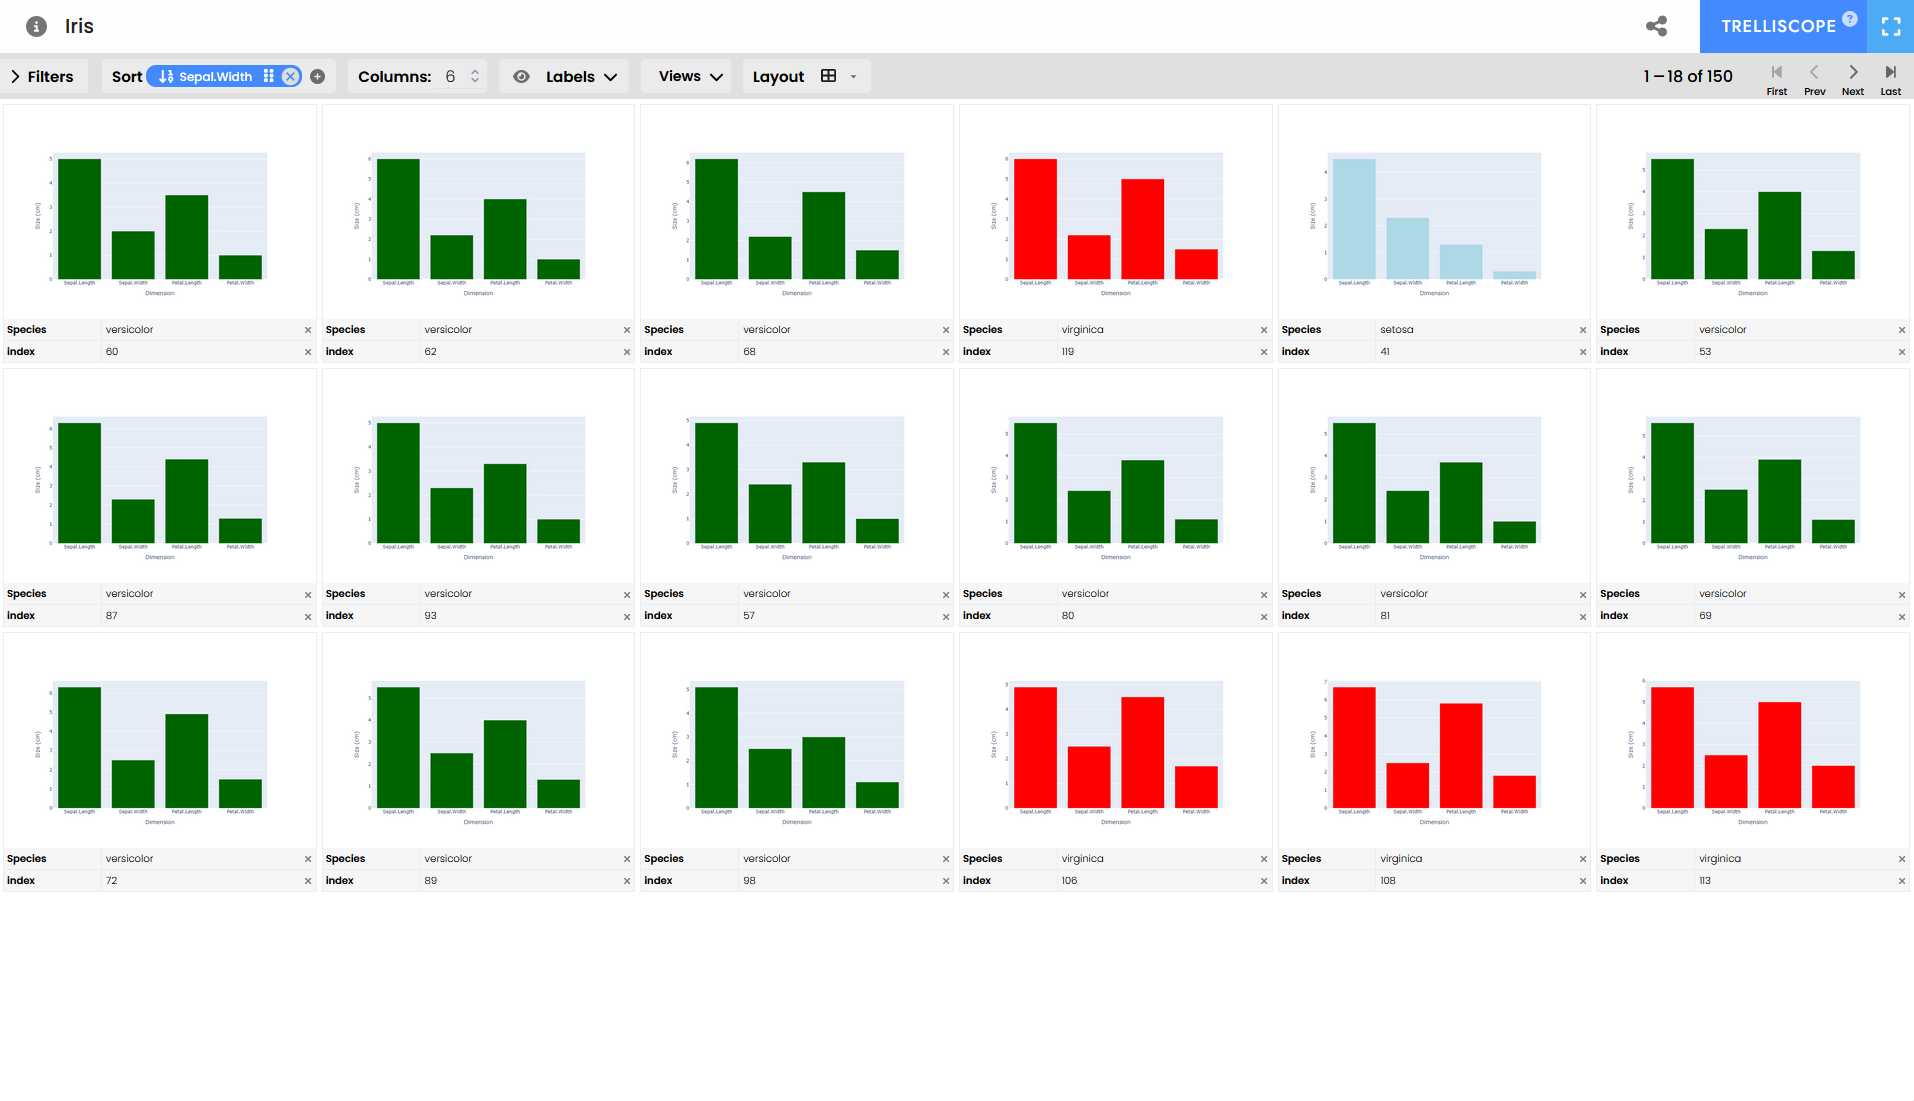
Expected output#
Increase the number of panels shown and sort by Sepal.Width and see if you can spot the patterns that differentiate flower species.
TrelliscopeJS demos#
This example shows how Trelliscope widgets can be shown within Jupyter notebooks, even from remote locations. However, this is not yet working for the latest version of trelliscopejs-lib. As such, this example shows the intended goal.
The latest version of Trelliscope uses new data schemas and is packaged differently.
Using a previous version of trelliscopejs-lib we can embed the widget in notebooks by displaying the HTML. For this we follow instructions from the TrelliscopeJS documentation here: https://hafen.github.io/trelliscopejs/articles/trelliscopejs.html#embedding-trelliscopejs-apps
This can be wrapped into an easy widget. But, how does this work with the latest versions of Trelliscope?
TODO: Use the latest Trelliscope-lib version |
|---|
[3]:
from IPython.display import display, HTML
[4]:
html_string = """
<head>
<meta charset="utf-8"/>
<script src="https://unpkg.com/trelliscopejs-lib@0.1.12/dist/trelliscope.min.js"></script>

</head>
<body>
<div id="8a43f2dd" class="trelliscope-not-spa" style="width:100%; height:500px;"></div>
<script>
  (function() {
    trelliscopeApp('8a43f2dd',
      'https://hafen.github.io/trelliscopejs-demo/housing/appfiles/config.jsonp');
  })();
</script>
</body>
"""
display(HTML(html_string))
[5]:
html_string = """
<head>
<meta charset="utf-8"/>
<script src="https://unpkg.com/trelliscopejs-lib@0.1.12/dist/trelliscope.min.js"></script>

</head>
<body>
<div id="32b2482a" class="trelliscope-not-spa" style="width:100%; height:500px;"></div>
<script>
  (function() {
    trelliscopeApp('32b2482a',
      'https://hafen.github.io/trelliscopejs-demo/gapminder/appfiles/config.jsonp');
  })();
</script>
</body>
"""
display(HTML(html_string))
[6]:
html_string = """
<head>
<meta charset="utf-8"/>
<script src="https://unpkg.com/trelliscopejs-lib@0.1.12/dist/trelliscope.min.js"></script>

</head>
<body>
<div id="aa7b91b4" class="trelliscope-not-spa" style="width:100%; height:500px;"></div>
<script>
  (function() {
    trelliscopeApp('aa7b91b4',
      'https://hafen.github.io/trelliscopejs-demo/pokemon/appfiles/config.jsonp');
  })();
</script>
</body>
"""
display(HTML(html_string))
[ ]: