Example: Gapminder dataset#
https://www.gapminder.org/data/documentation/
Gapminder contains yearly data for countries worldwide. In this example we will be taking a look at the Life Expectancy per country throughout the years.
Imports
[1]:
import pandas as pd
import plotly.express as px

from trelliscope import Trelliscope
from trelliscope.facets import facet_panels
from trelliscope.state import NumberRangeFilterState
from trelliscope.examples.get_data import get_example_data
Load dataset#
[2]:
USE_SMALL_DATASET = True
gapminder = get_example_data("gapminder")

if USE_SMALL_DATASET:
    df = gapminder
else:
    df = gapminder

df.head()
[2]:
| country | continent | year | lifeExp | pop | gdpPercap | capital | latitude | longitude | iso_alpha2 | |
|---|---|---|---|---|---|---|---|---|---|---|
| 0 | Afghanistan | Asia | 1952 | 28.801 | 8425333 | 779.445314 | Kabul | 34.5289 | 69.1725 | AF |
| 1 | Afghanistan | Asia | 1957 | 30.332 | 9240934 | 820.853030 | Kabul | 34.5289 | 69.1725 | AF |
| 2 | Afghanistan | Asia | 1962 | 31.997 | 10267083 | 853.100710 | Kabul | 34.5289 | 69.1725 | AF |
| 3 | Afghanistan | Asia | 1967 | 34.020 | 11537966 | 836.197138 | Kabul | 34.5289 | 69.1725 | AF |
| 4 | Afghanistan | Asia | 1972 | 36.088 | 13079460 | 739.981106 | Kabul | 34.5289 | 69.1725 | AF |
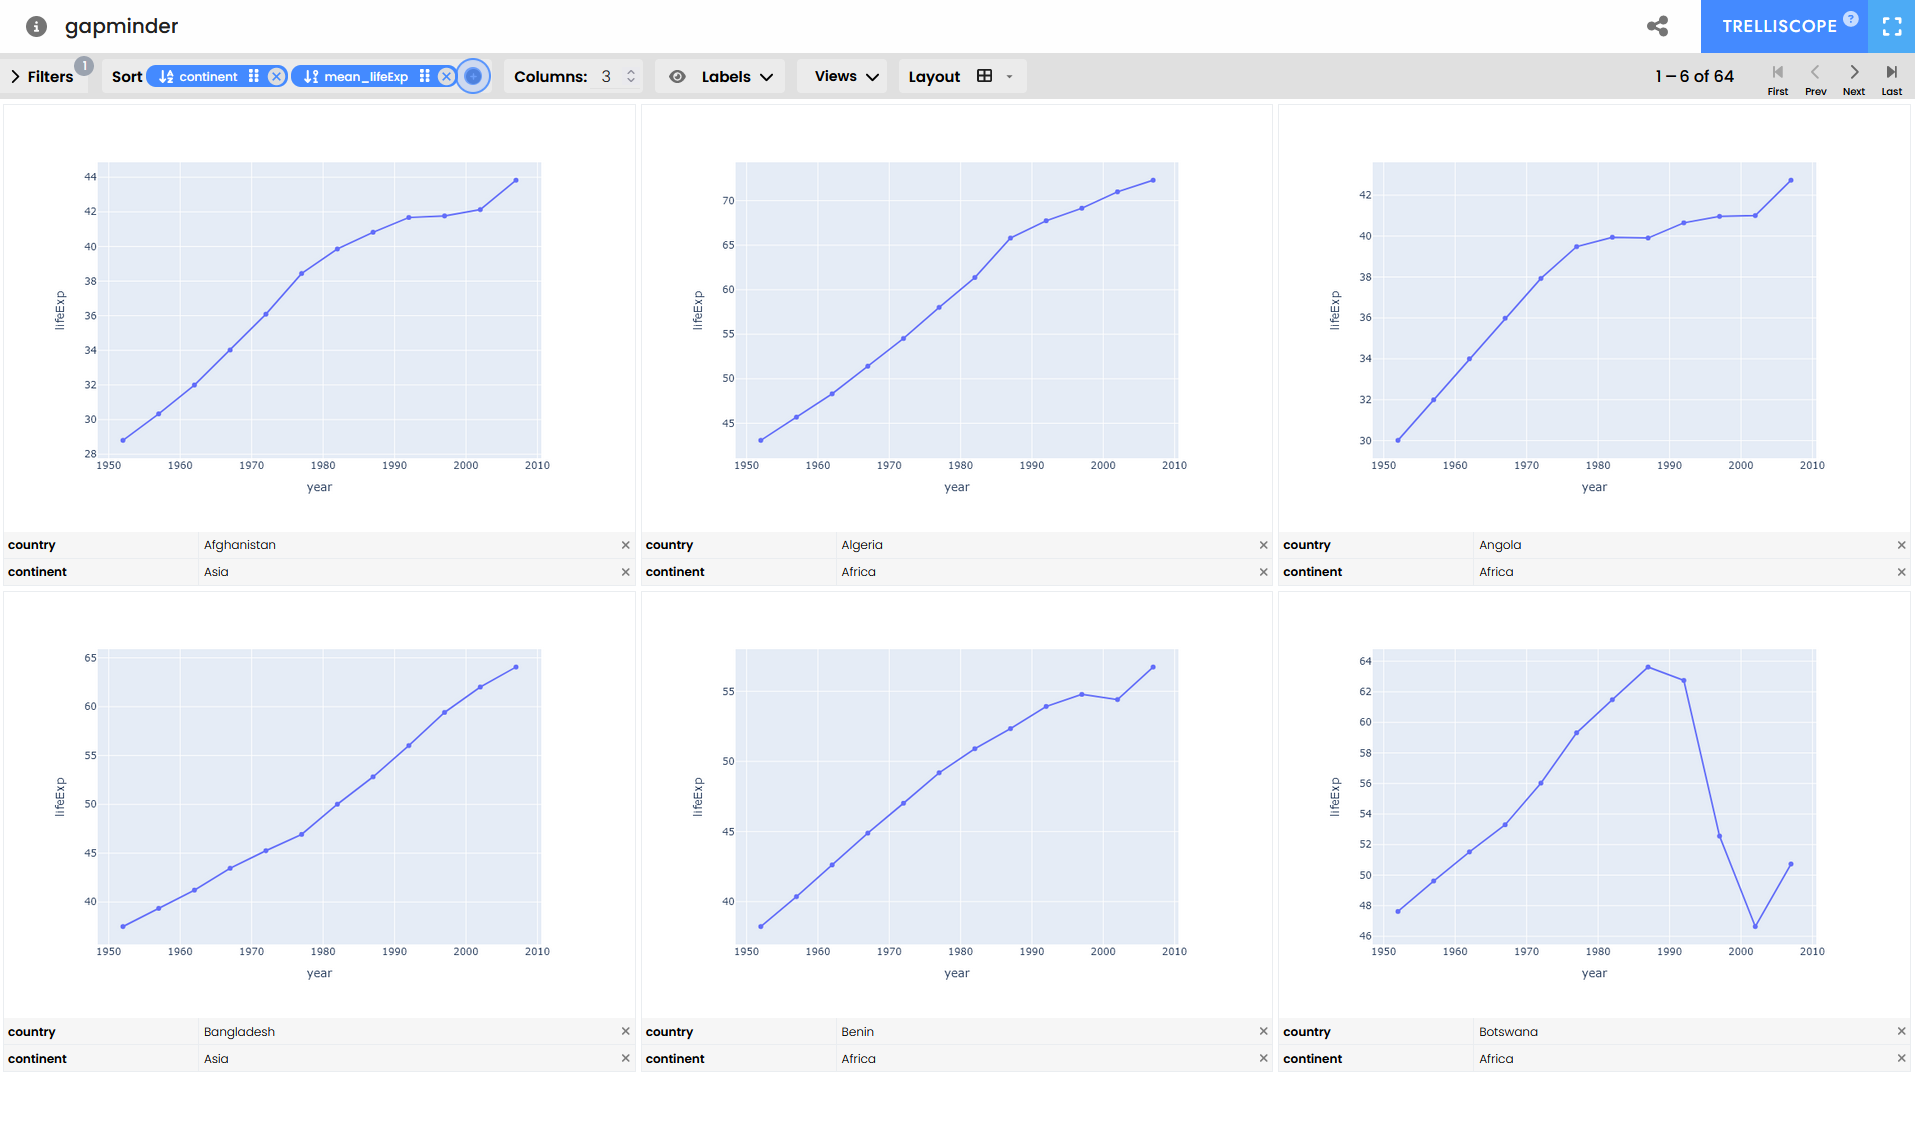
Create graphs#
The gapminder data contains timeseries. Let’s create a linegraph showing the Life Expectancy over time for each country.
Generate facet plots#
Grammar of Graphics. Use facet_panels() to create a Plotly graph for each small data frame.
Decide how you need to group the data, in this case we group the data by
country,continentandiso_alpha2.Use a plotting function to create a figure for each group. Here we use
px.linefrom https://plotly.com/python/line-charts/
The output is a grouped dataframe, with a column containing plotly.Figure objects.
[3]:
df_panels = facet_panels(
    df=df,
    panel_column_name="lifeExp_time",
    facet_columns=["country", "continent", "iso_alpha2"],
    plot_function=px.line,
    params={"x": "year", "y": "lifeExp", "markers": True},
)
df_panels.head()
[3]:
| lifeExp_time | |||
|---|---|---|---|
| country | continent | iso_alpha2 | |
| Afghanistan | Asia | AF | Figure({\n 'data': [{'hovertemplate': 'year... |
| Albania | Europe | AL | Figure({\n 'data': [{'hovertemplate': 'year... |
| Algeria | Africa | DZ | Figure({\n 'data': [{'hovertemplate': 'year... |
| Angola | Africa | AO | Figure({\n 'data': [{'hovertemplate': 'year... |
| Argentina | Americas | AR | Figure({\n 'data': [{'hovertemplate': 'year... |
Preview a single graph#
We can select a single figure and preview it before we generate the entire Trelliscope display.
[4]:
# required to render plotly figure with nbconvert
from IPython.display import display, HTML
display(HTML('<script src="http://requirejs.org/docs/release/2.1.6/comments/require.js"></script>'))
[5]:
df_panels.loc[("United Kingdom", "Europe", "GB"), "lifeExp_time"].show()
Create metadata#
Each figure is joined with metadata about the data in the graph. To do this we group the data using the same groups as each figure, and then aggregate the data.
[6]:
# Aggregate statistics per panel
df_meta = (
    df
    .groupby(["country", "continent", "iso_alpha2"])
    .agg(
        mean_lifeExp=("lifeExp", "mean"),
        min_lifeExp=("lifeExp", "min"),
        max_lifeExp=("lifeExp", "max"),
        mean_gdp=("gdpPercap", "mean"),
        first_year=("year", "min"),
        latitude=("latitude", "first"),
        longitude=("longitude", "first"),
    )
    .reset_index()
)

# Add additional metadata to each group
df_meta = (
    df_meta
    .assign(
        first_data=pd.to_datetime(df_meta["first_year"], format="%Y"),
        wiki=df_meta["country"].apply(lambda x: f"https://en.wikipedia.org/wiki/{x}")
    )
)
Join panels and metadata#
Combine the panel figures and their data attributes into a single dataframe to create the Trelliscope input data.
[7]:
# Join metas with panels
df_joined = df_panels.merge(df_meta, on=["country", "continent", "iso_alpha2"], validate="1:1")
df_joined.head()
[7]:
| country | continent | iso_alpha2 | lifeExp_time | mean_lifeExp | min_lifeExp | max_lifeExp | mean_gdp | first_year | latitude | longitude | first_data | wiki | |
|---|---|---|---|---|---|---|---|---|---|---|---|---|---|
| 0 | Afghanistan | Asia | AF | Figure({\n 'data': [{'hovertemplate': 'year... | 37.478833 | 28.801 | 43.828 | 802.674598 | 1952 | 34.5289 | 69.1725 | 1952-01-01 | https://en.wikipedia.org/wiki/Afghanistan |
| 1 | Albania | Europe | AL | Figure({\n 'data': [{'hovertemplate': 'year... | 68.432917 | 55.230 | 76.423 | 3255.366633 | 1952 | 41.3275 | 19.8189 | 1952-01-01 | https://en.wikipedia.org/wiki/Albania |
| 2 | Algeria | Africa | DZ | Figure({\n 'data': [{'hovertemplate': 'year... | 59.030167 | 43.077 | 72.301 | 4426.025973 | 1952 | 36.7525 | 3.0420 | 1952-01-01 | https://en.wikipedia.org/wiki/Algeria |
| 3 | Angola | Africa | AO | Figure({\n 'data': [{'hovertemplate': 'year... | 37.883500 | 30.015 | 42.731 | 3607.100529 | 1952 | -8.8368 | 13.2343 | 1952-01-01 | https://en.wikipedia.org/wiki/Angola |
| 4 | Argentina | Americas | AR | Figure({\n 'data': [{'hovertemplate': 'year... | 69.060417 | 62.485 | 75.320 | 8955.553783 | 1952 | -34.6051 | -58.4004 | 1952-01-01 | https://en.wikipedia.org/wiki/Argentina |
Create Trelliscope#
Set various parameters explicitly by piping method Trelliscope. In this example we create the Trelliscope and let it infer which column contains the figure, and which contain meta attributes.
Configure the initial settings when opening the Trelliscope display by setting the default label, layout, sorting and filter options.
[8]:
tr = (
    Trelliscope(df_joined, name="gapminder", show_progress_bar=False)
    .set_default_labels(["country", "continent", "iso_alpha2"])
    .set_default_layout(3)
    .set_default_sort(
        ["continent", "mean_lifeExp"], sort_directions=["asc", "desc"]
    )
    .set_default_filters([NumberRangeFilterState("mean_lifeExp", 30, 60)])
    .write_display()
)
INFO:root:Using ['country'] to uniquely identify each row of the data.
INFO:root:Replacing entire existing sort state specification
INFO:root:Saving to /tmp/tmpn8kmp4_6/gapminder
INFO:root:Trelliscope written to `/tmp/tmpn8kmp4_6/gapminder`
[9]:
# Open Trelliscope in a new tab
tr.view_trelliscope()
[9]:
A trelliscope display
* Name: gapminder
* Description: gapminder
* Tags: None
* Key columns: ['country']
---
* Path: /tmp/tmpn8kmp4_6
* Number of panels: 1
---
* Meta Info:
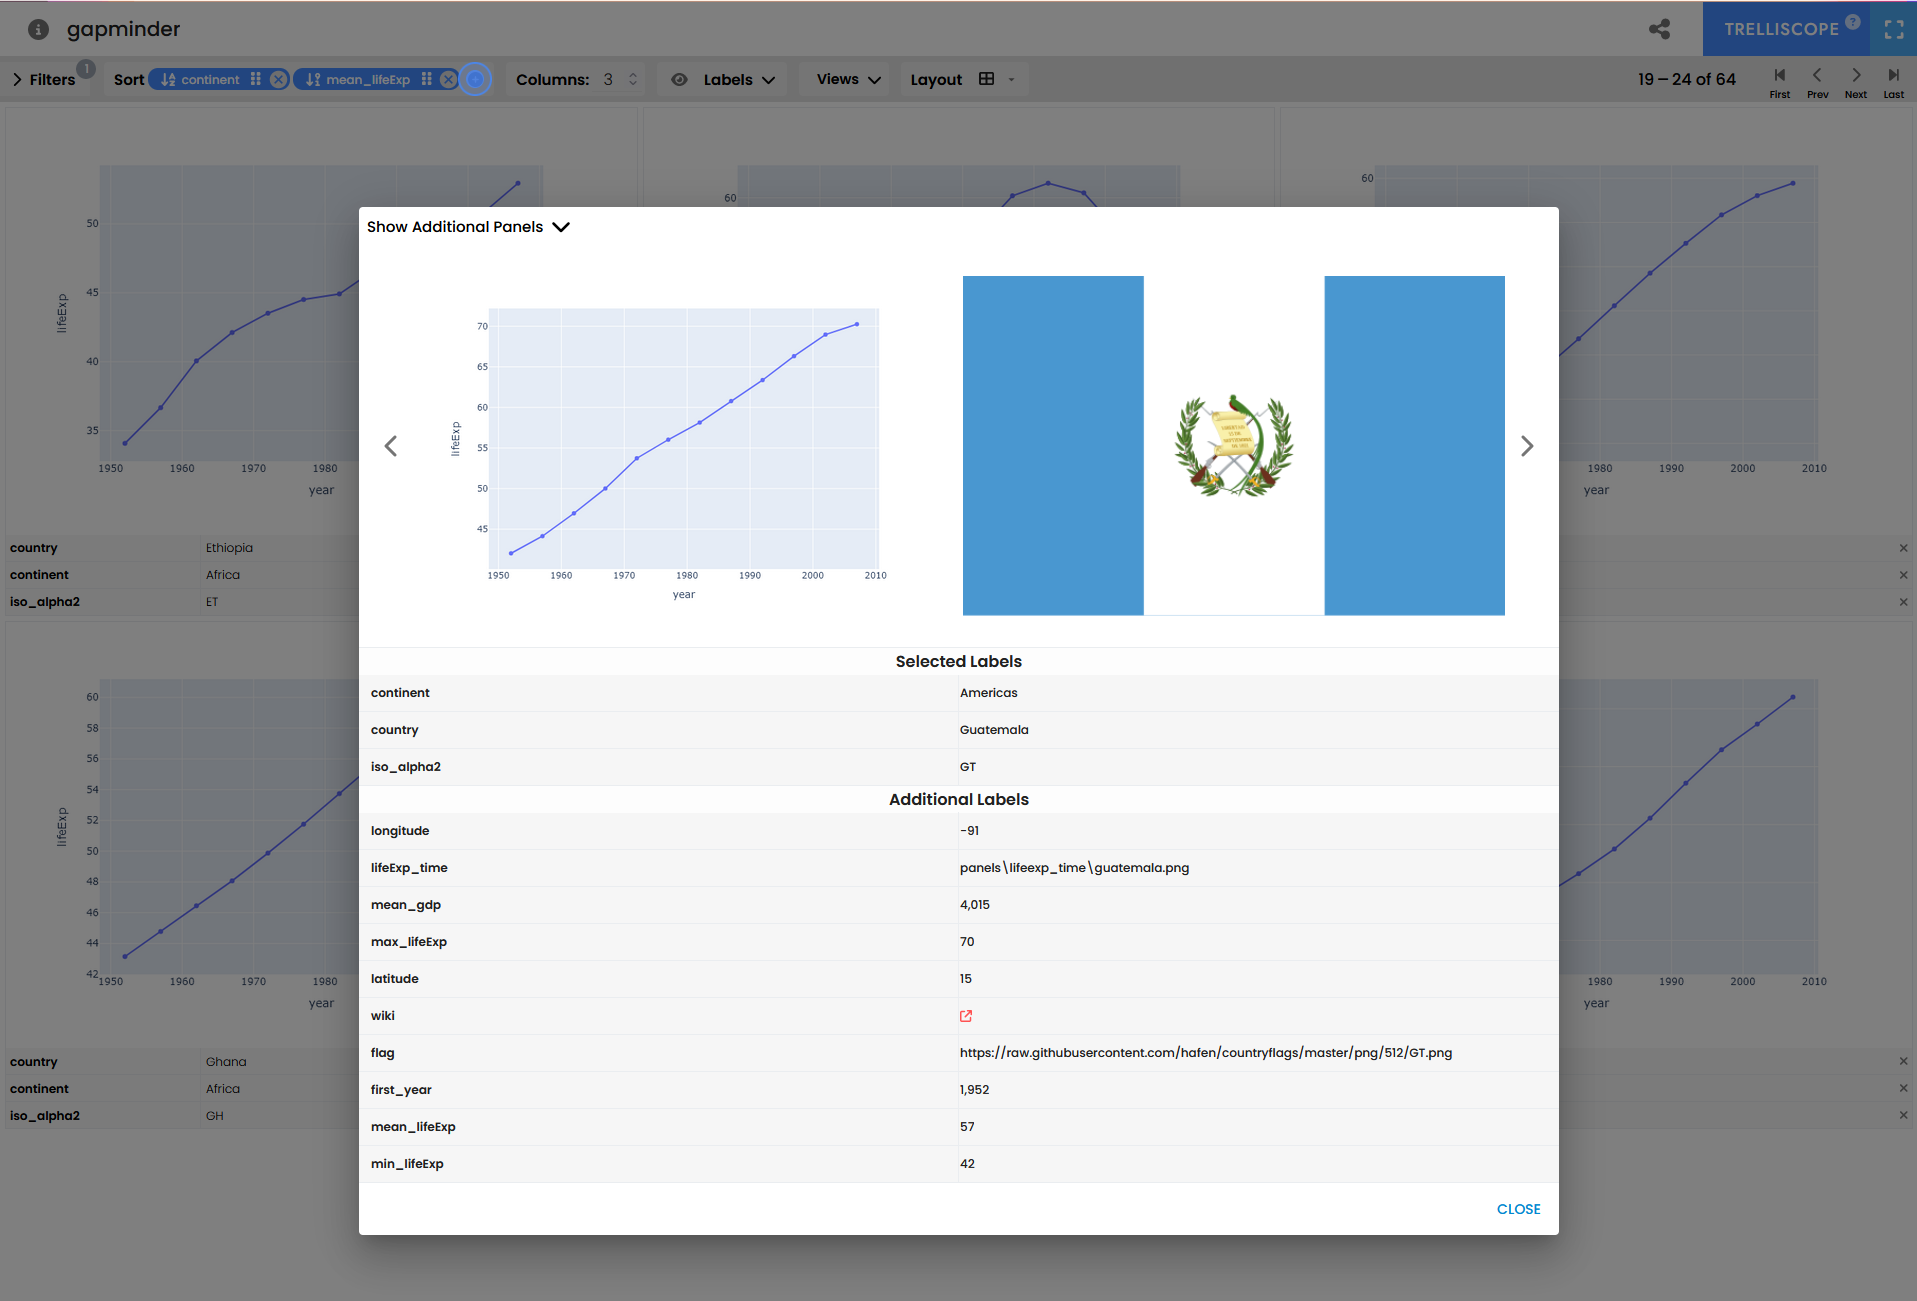
Add secondary panel#
We can add an additional image for each panel, such as the country flags.
Add flags#
We create a new dataframe with images in a column, referencing remote image files of country flags.
[10]:
# The flag column will hold references to the local files
flag_base_url = "https://raw.githubusercontent.com/hafen/countryflags/master/png/512/"
df_flags = (
    df_meta
    [["country", "continent", "iso_alpha2"]]
    .assign(
        # flag=df_meta["iso_alpha2"].apply(lambda x: (local_flags_path / f"{x}.png").as_posix()),
        flag=df_meta["iso_alpha2"].apply(lambda x: f"{flag_base_url}{x}.png")
    )
)
df_flags
[10]:
| country | continent | iso_alpha2 | flag | |
|---|---|---|---|---|
| 0 | Afghanistan | Asia | AF | https://raw.githubusercontent.com/hafen/countr... |
| 1 | Albania | Europe | AL | https://raw.githubusercontent.com/hafen/countr... |
| 2 | Algeria | Africa | DZ | https://raw.githubusercontent.com/hafen/countr... |
| 3 | Angola | Africa | AO | https://raw.githubusercontent.com/hafen/countr... |
| 4 | Argentina | Americas | AR | https://raw.githubusercontent.com/hafen/countr... |
| ... | ... | ... | ... | ... |
| 117 | Uganda | Africa | UG | https://raw.githubusercontent.com/hafen/countr... |
| 118 | United Kingdom | Europe | GB | https://raw.githubusercontent.com/hafen/countr... |
| 119 | Uruguay | Americas | UY | https://raw.githubusercontent.com/hafen/countr... |
| 120 | Zambia | Africa | ZM | https://raw.githubusercontent.com/hafen/countr... |
| 121 | Zimbabwe | Africa | ZW | https://raw.githubusercontent.com/hafen/countr... |
122 rows × 4 columns
Update Trelliscope#
[11]:
# Join metas with timeseries panels and flag panels
df_joined = (
    df_panels
    .merge(df_meta, on=["country", "continent", "iso_alpha2"], validate="1:1")
    .merge(df_flags, on=["country", "continent", "iso_alpha2"], validate="1:1")
)

# Write trelliscope
tr_with_flags = (
    Trelliscope(df_joined, name="gapminder", show_progress_bar=False)
    .set_default_labels(["country", "continent", "iso_alpha2"])
    .set_default_layout(3)
    .set_default_sort(
        ["continent", "mean_lifeExp"], sort_directions=["asc", "desc"]
    )
    .set_default_filters([NumberRangeFilterState("mean_lifeExp", 30, 60)])
    .write_display()
)

tr_with_flags.view_trelliscope()
INFO:root:Using ['country'] to uniquely identify each row of the data.
INFO:root:Replacing entire existing sort state specification
INFO:root:Saving to /tmp/tmpz3l6v31f/gapminder
INFO:root:Trelliscope written to `/tmp/tmpz3l6v31f/gapminder`
[11]:
A trelliscope display
* Name: gapminder
* Description: gapminder
* Tags: None
* Key columns: ['country']
---
* Path: /tmp/tmpz3l6v31f
* Number of panels: 2
---
* Meta Info:
You can highlight a panel and find the flag under Show Additional Panels in the top-left.
[ ]: